Pivot Table Beta402
Pages:
1

|
MikeMills private msg quote post Address this user | |
| We've added a new dashboard pivot table widget and are asking for feedback. Anyone is welcome to try it out while it is in beta. We will be making this feature only available for certain pricing plans after the beta. To get access to the new pivot table widget: 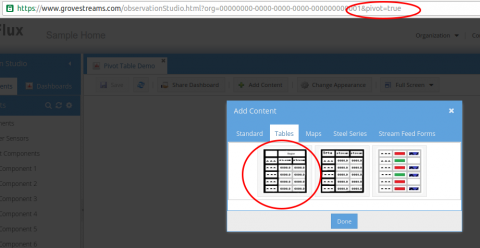 1) Add &pivot=true onto the observation studio url in your browser and click Enter 2) Create a dashboard, select Add Content and then select the pivot table A pivot table usually requires a lot of space. Select Change Appearance, select Layout, and change the number of columns to 1. Increase the height of the widget by clicking on the plus (+) widget toolbar icon. Untoggle Change Appearance to remove the dashboard from its design state as there is a known drag and drop bug while the table is in design mode. 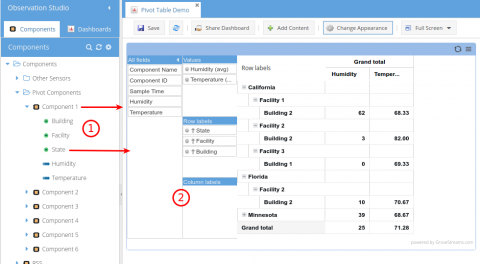 1) Drag individual streams or entire components onto the table 2) Use the configurator on the left to drag fields from the All fields column into values, rows, or columns 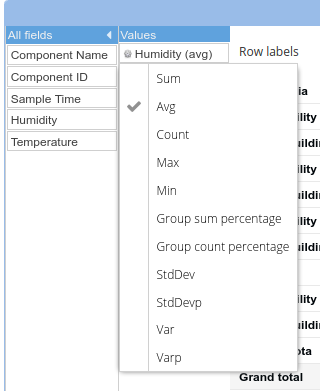 Click on a value field, within the configurator, to select how aggregation is performed. 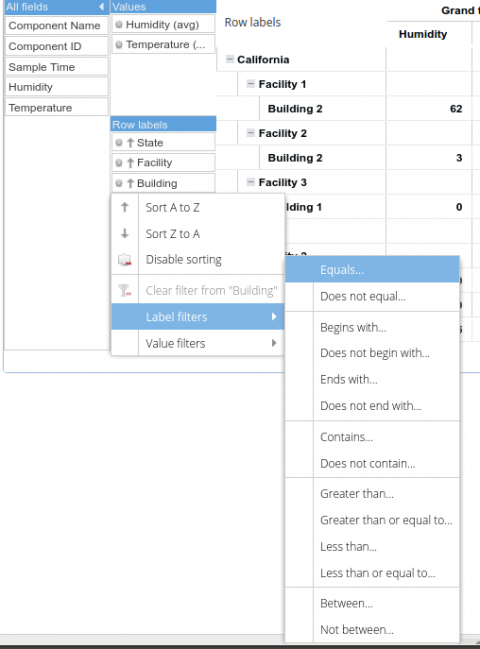 Click on a row or column field to sort or create filters 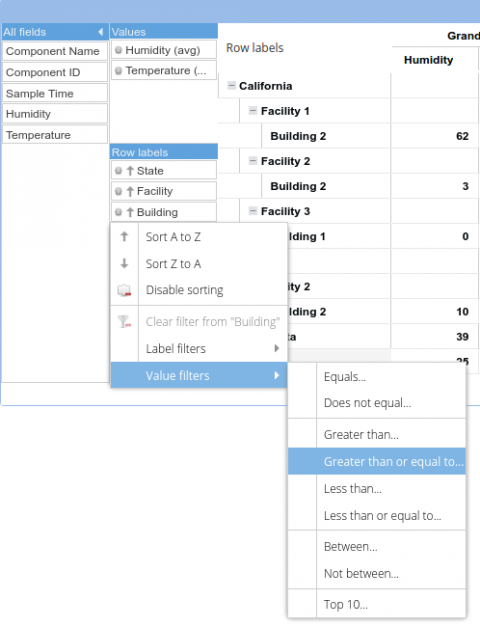 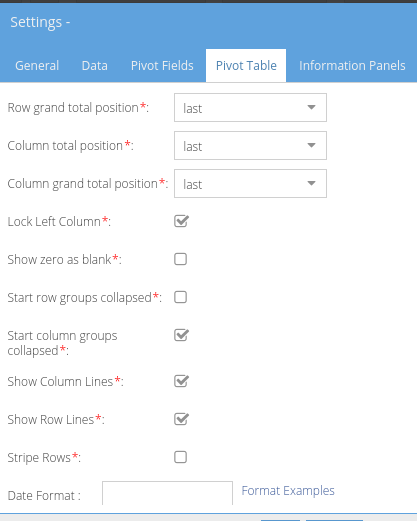 Many widget settings 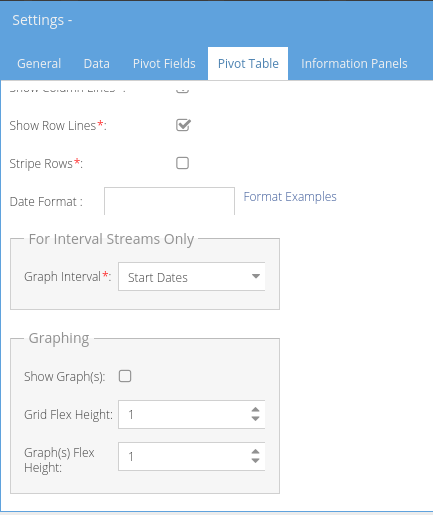 We have temporarily added the ability to graph what's visible within a pivot grid. Engage graphing within the widget settings dialog. Flex height determines how much height the table and graph will occupy. 1 and 1 will indicate that they both occupy 50% of the space. 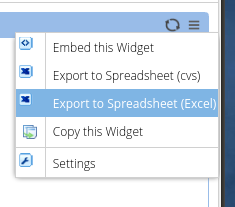 Two Export options. 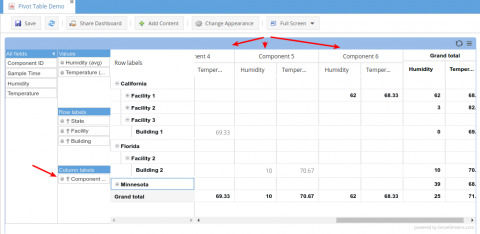 Move fields around in the configurator to change the view. Enjoy! Feedback appreciated. |
||
| Post 1 • IP flag post | ||

|
MikeMills private msg quote post Address this user | |
Added the ability to drop Pivot Graphs onto a dashboard. These charts are "linked" to a pivot grid on the same dashboard and include most of the same configuration settings as our stream (time-series) graphs.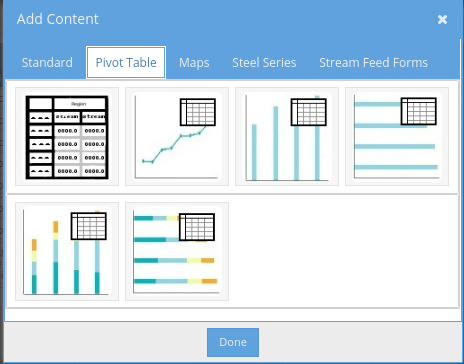 |
||
| Post 2 • IP flag post | ||

|
MikeMills private msg quote post Address this user | |
| Fixed many issues related to Pivot charts. | ||
| Post 3 • IP flag post | ||
|
|
christnufc private msg quote post Address this user | |
| Hi I am trying to work with pivot tables and stream groups. Unfortunately it does not seem possible to differentiate individual streams as the pivot table only seems to work at component level. Is there a way to show the information I require? I have three stream groups each with two streams from the same component. Currently I can show the information at component level (see attached). The problem is that the pivot table shows both stream data on the same row of the pivot table. How do I show stream level info - ie how do I add a second field to the pivot table row (stream name)? WHAT I CURRENTLY HAVE Component 1 Component 2 Component 3 WHAT I REQUIRE Component 1 Stream 1 Stream 2 Component 2 Stream 1 Stream 2 Component 3 Stream 1 Stream 2 Regards Chris 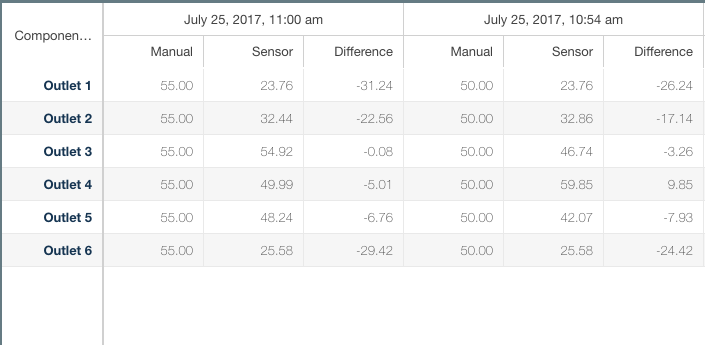 |
||
| Post 4 • IP flag post | ||

|
MikeMills private msg quote post Address this user | |
| @christnufc - Sorry for the long delay for a reply. We've been thinking about this one and whether we can do a simple enhancement to allow this. It doesn't seem like this is possible today without a significant enhancement by us. | ||
| Post 5 • IP flag post | ||
Pages:
1