Bandwidth379
Pages:
1

|
ctmorrison private msg quote post Address this user | |
| At my most recent installation, I have 7 devices pushing data, with six of them only pushing 2 numeric streams. I'm a bit surprised as to the bandwidth reported via the "Usage" portion of the account information. Does the bandwidth calculation include all TCP overhead? All other sites I've implemented use one device to report multiple streams, as many as 12. I'm seeing far less bandwidth being utilized. Perhaps I was mistaken when thinking the bandwidth was relative to the actual data being pushed. Is there documentation I can read to better understand how bandwidth is calculated? | ||
| Post 1 • IP flag post | ||

|
MikeMills private msg quote post Address this user | |
| We haven't changed our bandwidth calculation logic in a long time. So your bytes In is higher than expected? Or are you seeing the Bytes Out higher than expected? Our bandwidth calculation is very simple. We sum the size of the URL parameters with the size of the HTTP body for only API calls involving organization data. Web pages and graphics are ignored - only GS API calls are part of the bandwidth calculation. For example, "Bytes In" sums up: * The size of the URL query string, which is the part of the URL containing the parameters and their values * For HTTP requests, the size of the HTTP body, which usually maps to the "Content-Length" header. Note that we ignore cookies during our calculation so you're better off passing the api_key as a cookie. Does API tracing offer any clues? |
||
| Post 2 • IP flag post | ||

|
ctmorrison private msg quote post Address this user | |
| To pass api_key as a cookie via a Particle webhook, it would appear I need to create a header such as: Cookie : api_key=999999999999999999999999999 Is that correct? I pass the actual key from the device which retrieves its key via another API call for its configuration. Therefore, I'd likely create a header such as: Cookie : api_key={{k}} where k is the api key passed to the webhook Does this make sense and please confirm my understanding this would reduce the BYTES IN count by ~45 bytes per PUT since you don't count these bytes in your calculation. |
||
| Post 3 • IP flag post | ||

|
MikeMills private msg quote post Address this user | |
| I believe it will reduce your I/O as we ignore the header in our metrics calcs. We just measure the query string part of the URL and the body of the request. Our Python example is setting the api_key as a cookie. |
||
| Post 4 • IP flag post | ||

|
ctmorrison private msg quote post Address this user | |
| At the risk of being pain, when you say "the query string part of the URL" do you simply mean the part after the "?"? I was clearly under the impression you were also counting TCP overhead associated with the HTTP protocol. Ignore this...I just reread your message above! |
||
| Post 5 • IP flag post | ||
|
|
dmarks private msg quote post Address this user | |
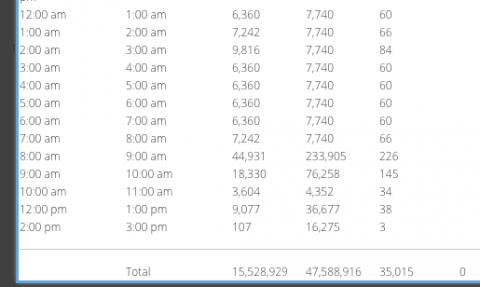
Looking at the usage report, I notice there are hours missing. Does this mean there were simply no BYTES IN, BYTES OUT, Transactions or Notifications during that hour (ex 11:00-12:00p and 1:00-2:00p)? |
||
| Post 6 • IP flag post | ||
Pages:
1