Browser reporting "Not Responding" Errors192
Pages:
1

|
MikeMills private msg quote post Address this user | |
| Some dashboards that contain a graph with many data points may consume too many browser resources and the browser may become unresponsive or report a Not Responding error message. We've received a couple of reports about this and have seen it once or twice ourselves. We're currently investigating this. |
||
| Post 1 • IP flag post | ||

|
MikeMills private msg quote post Address this user | |
| This seems to be an issue that has popped up within the last month or so. | ||
| Post 2 • IP flag post | ||

|
MikeMills private msg quote post Address this user | |
| We've just upgraded our charting package to a newer version. We're hoping this resolves the problem. Let us know if you still experience this (include the number of points on your graph). | ||
| Post 3 • IP flag post | ||

|
ctmorrison private msg quote post Address this user | |
| Still having issues with dashboards complaining of long running scripts. One of the dashboards has 4 line graphs--3 of them having 7 streams and one having 3 streams. Each graph shows the last 480 points of 1 minute data and they're set to poll every 60 seconds. The dashboard also has 3 or 4 steel series widgets, each with 7 streams and they are also polled every 60 seconds. We're having continued problems with the dashboards hanging and even hanging browsers due to this window being open (multiple browsers on Windows and Macs). The organization is "HVAC StarPlus" and one of the problematic dashboards is "StarLites 1-7". The problem occurs both when you're logged in or simply viewing a shared version. We believe we've viewed this type of dashboard in the (distant) past without issue. I've not confirmed this, but I suspect it has to do with the polling feature. I may update the dashboard and turn off polling for all the widgets. |
||
| Post 4 • IP flag post | ||

|
ctmorrison private msg quote post Address this user | |
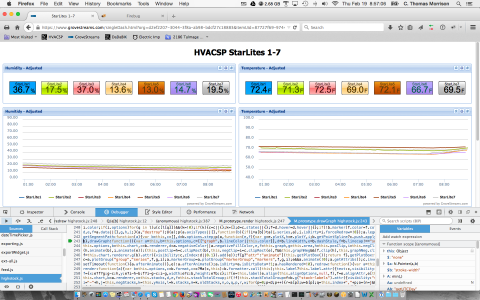
Here's a screenshot of where Firefox seems to be stalling (I assume)... |
||
| Post 5 • IP flag post | ||

|
ctmorrison private msg quote post Address this user | |
| I've changed the dashboard to a 5 minute poll and created another without polling (0 seconds). I'll report how these behave. | ||
| Post 6 • IP flag post | ||

|
MikeMills private msg quote post Address this user | |
| I'm looking at it now without issues. I did reproduce this issue once or twice a couple of weeks ago and I could see that the line chart was consuming the resources. It's tough to fix unless I can reproduce it. If you see it happen, check your system resources (memory and cpu) and see how much is used. I'm wondering if memory has to be low and swap filing is occurring. |
||
| Post 7 • IP flag post | ||

|
MikeMills private msg quote post Address this user | |
| OK. It locked up while I was posting that last entry... | ||
| Post 8 • IP flag post | ||

|
ctmorrison private msg quote post Address this user | |
| Question -- if I have shared a dashboard and subsequently change settings on the dashboard in GS, does the shared dashboard get those new settings, too, which is what I'm assuming? | ||
| Post 9 • IP flag post | ||

|
MikeMills private msg quote post Address this user | |
| Yes, but only when the user reopens their browser or does and F5. | ||
| Post 10 • IP flag post | ||

|
ctmorrison private msg quote post Address this user | |
| OK. I believe I've confirmed the "bug" has to do with the polling aspect. I changed the polling from 60 to 300 seconds and now the browsers seem to work fine until the polling period expires. This behavior appears to be consistent across Safari, Firefox and Chrome. |
||
| Post 11 • IP flag post | ||

|
ctmorrison private msg quote post Address this user | |
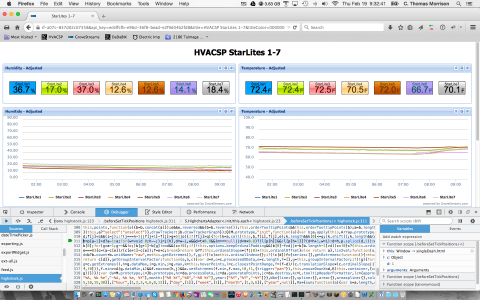
Again, FWIW, here's another Firefox debug screenshot. |
||
| Post 12 • IP flag post | ||

|
ctmorrison private msg quote post Address this user | |
| BTW...I have 16GB on my system with ~3.5GB free when this is happening, so I don't think it's a memory issue. I have a app that alerts me when memory gets below 1GB and I have not seen it raise an alert. In addition, this is happening on multiple systems...not just mine which very rarely experiences this issue. | ||
| Post 13 • IP flag post | ||

|
MikeMills private msg quote post Address this user | |
| Just applied a patch for this. Initial tests seem good. Hit F5, set your polling back to what it was and let us know if you are still experiencing this issue. What we fixed: Our charts were redrawing as each new sample was appended after each poll. We changed it so that all points are added and then a redraw occurs. This prevents the chart's graphic engine from overwhelming the browser's processing ability. |
||
| Post 14 • IP flag post | ||

|
ctmorrison private msg quote post Address this user | |
| So far, so good! I'll keep you posted if we see the problem re-surface. Thanks for taking time to resolve this! You guys are great! | ||
| Post 15 • IP flag post | ||
Pages:
1