New - Multi-pane Graphs243
Pages:
1

|
MikeMills private msg quote post Address this user | |
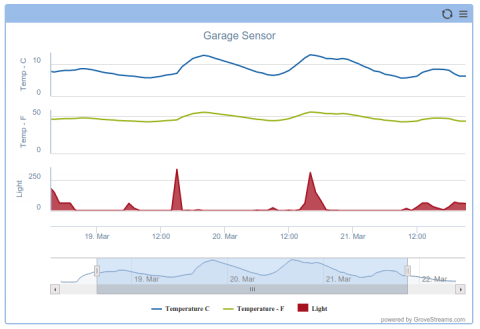
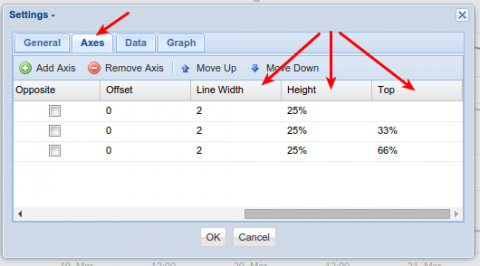
We've added the ability to display each axes within its own pane on the same graph while using the same navigator bar for all panes: We've added three new axes settings to configure your chart for multiple panes:  * Line Width: The width of the Y axis line. * Height: The height of the Y axis. If it's a number, it is interpreted as pixels. If it's a percentage string, it is interpreted as percentages of the total plot height. * Top: The top position of the Y axis. If it's a number, it is interpreted as pixel position relative to the chart. If it's a percentage string, it is interpreted as percentages of the plot height, offset from plot area top. |
||
| Post 1 • IP flag post | ||
|
|
Phill private msg quote post Address this user | |
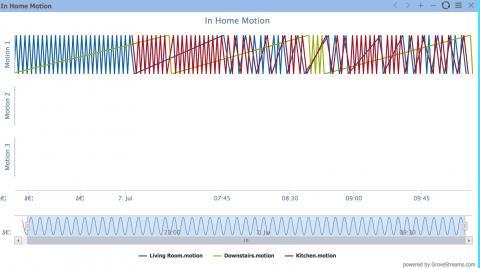
| I am not getting the same results as your image... all of my graphs are stacked in the top run with nothing in the bottom 2 - what am I missing here? | ||
| Post 2 • IP flag post | ||
|
|
Phill private msg quote post Address this user | |
| Ignore... found it in the data settings... | ||
| Post 5 • IP flag post | ||
Pages:
1
