Display Last Sample Time503
Pages:
1|
|
Josephny private msg quote post Address this user | |
| Hello, I monitor temperature (and other) data from 8 sources and have been doing so using a basic line chart showing temp of each on the Y axis and date/time on the X axis. I would like to create a widget (perhaps a Steel series) that displays the current (or last provided) temp as well as the time that sample was received by GS. I can't figure out how to get the date/time to show. Is there a basic widget option available to do this? Thank you! Joseph |
||
| Post 1 • IP flag post | ||

|
MikeMills private msg quote post Address this user | |
| Try our new dashboard editor in the mobile site. It has some new widgets that might help you. Try this: * Make a copy of the dashboard in component studio * On your start page, click the Mobile menu option at the top * Navigate to Dashboards, Select the copied dashboard, Choose Edit * Add the new Simple Big Number widget. It should do what you need. |
||
| Post 2 • IP flag post | ||
|
|
Josephny private msg quote post Address this user | |
| Hi Mike, Thanks very much! I followed the instructions and made the widget below. Having difficulty with it not showing up on the non-mobile site -- shows up (I believe) as a solid black colored area. Went back into mobile but unable to edit it. 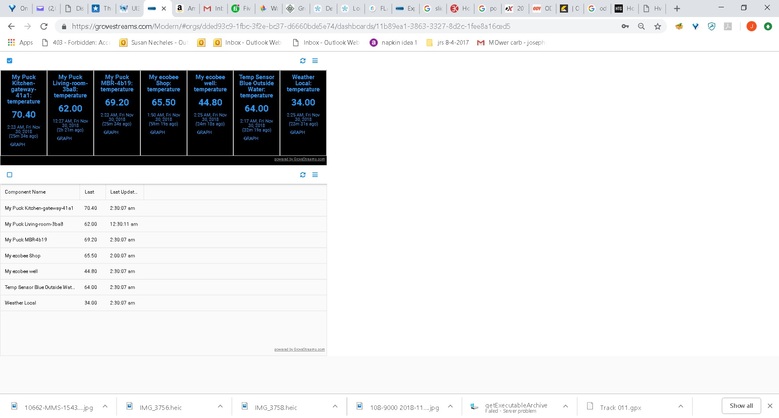 |
||
| Post 3 • IP flag post | ||
|
|
MikeMills private msg quote post Address this user | |
| The new dashboards are still being shaken out. They can't be opened in the studio - not yet. | ||
| Post 4 • IP flag post | ||
|
|
MikeMills private msg quote post Address this user | |
Quote:Originally Posted by Josephny You can't edit it in the mobile site anymore? Did you attempt to edit it in the studio and save it? If so, it will corrupt the dashboard. |
||
| Post 5 • IP flag post | ||
Pages:
1