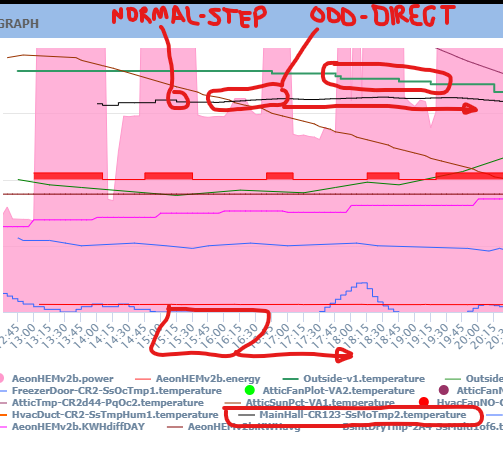
unexpected change in graph line from step to "direct"/non-step528
Pages:
1|
|
ero4444 private msg quote post Address this user | |
| unexpected change in graph line from step to "direct"/non-step FYI, On July8 around 4pm EDT, after years of normal step-wise line graphing of a room temperature, this stream graph changed to plot a typical direct/non-step line since that time. Yet other temperature stream graph lines are still plotting step lines since that time. So it's odd... I will attempt to attach a screenshot of the graph clip around July8 1600EDT below:  |
||
| Post 1 • IP flag post | ||

|
MikeMills private msg quote post Address this user | |
| Odd. We haven't modified any of that code in months. Maybe a browser upgrade uncovered a bug in the graphing library we used? - We can't reproduce it - Does it happen in another browser like Chrome or Firefox or ??? - Can you delete the browser cache and refresh the page and see if it goes away? |
||
| Post 2 • IP flag post | ||
|
|
ero4444 private msg quote post Address this user | |
| I see what is happening now. The COV/change-of-value/resolution was 1.0F, now it is 0.1F. If I had zoomed in enough then I would see the steps, and the of course all the unexpected stream values are in in its table. The change must have occurred to only certain device types and their streams. Thanks for listening. |
||
| Post 3 • IP flag post | ||
Pages:
1