Is there a way to create a "binary graph"?152

|
MikeMills private msg quote post Address this user | |
| We do not support that today. But, it appears the graphing package we use does support multiple graph panes. We'll add it to our feature request list. If you're good at coding or have access to developers, you can use our API in combination with a charting package (like the one we're using) and build your own web page. |
||
| Post 26 • IP flag post | ||
|
|
TravisR100 private msg quote post Address this user | |
| Appreciate you adding it to the list. The example I posted was created by a developer in my office who was playing around with capturing the data on one of our servers. Not sure what graph package he was using for the graphs. | ||
| Post 27 • IP flag post | ||
|
|
TravisR100 private msg quote post Address this user | |
| Back to the stepped graph discussion, I finally got around to trying it this morning. I have a graph widget with a single data stream on it that is a door open/close sensor. I have the data type to binary, I've selected step as the graph type. I do indeed get a step graph but it looks like a perfect square wave. The distance between the vertical lines on the graph is perfectly equal. Does that make sense? I'm sure I've got some setting wrong but can't figure out what it is. | ||
| Post 28 • IP flag post | ||
|
|
TravisR100 private msg quote post Address this user | |
| When I use the binary sensor only as the data I get a perfect square wave. If I add temp to that graph I get the open/close events spaced properly. Not sure what I' doing wrong here. | ||
| Post 29 • IP flag post | ||
|
|
TravisR100 private msg quote post Address this user | |
| And ero444, I see what you did now in making those two graphs appear to be one on top of the other. It's still not really what I'm looking for. Multiple charts synced to one navigator would be ideal. Further refined my example... automation.rciis.com In my example you don't even have to stack the graphs. They can be side by side. Also, in grovestreams, what determines which set up data the navigator uses? I have two sets of data, the temp and the open/close contact. The navigator seems to be using the open/close data although it is a spline type. Any way to set the navigator to use specific data set or line type? |
||
| Post 30 • IP flag post | ||

|
MikeMills private msg quote post Address this user | |
Quote:Originally Posted by TravisR100The 1st stream (topmost) on the data tab is used for the navigator. |
||
| Post 31 • IP flag post | ||

|
MikeMills private msg quote post Address this user | |
| We've implemented multi-pane graphs. See this thread. | ||
| Post 32 • IP flag post | ||
|
|
TravisR100 private msg quote post Address this user | |
| Excellent. Thanks, Mike. I'll check it out. | ||
| Post 33 • IP flag post | ||
|
|
xcguy private msg quote post Address this user | |
Digging up this old topic... Same issue as post #29. I'm trying to plot an open/close sensor over time, and the graph is showing evenly spaced events. 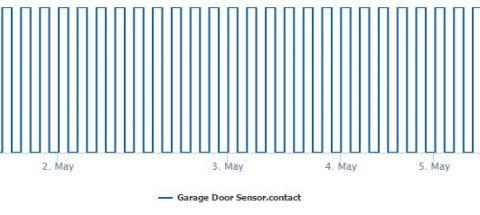 I'd like the spacing based on time, but can't seem to figure out how to modify the graph to show that binary graph with a time interval spacing. Any suggestions? |
||
| Post 34 • IP flag post | ||

|
MikeMills private msg quote post Address this user | |
| Try setting the Cycle on the first tab of the Graph's setting. | ||
| Post 35 • IP flag post | ||
|
|
xcguy private msg quote post Address this user | |
Seems to help some, but now some of the data points aren't graphing. I set the cycle to 15 seconds (added a new 15 second cycle). The data shows there should be spikes earlier in the day... 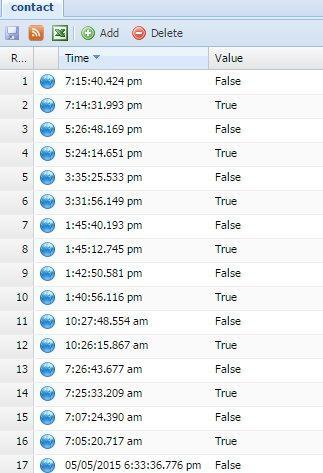 What am I missing? |
||
| Post 36 • IP flag post | ||

|
MikeMills private msg quote post Address this user | |
| Seems odd. What is: * The Stream's default rollup cycle (edit the component and select the stream and see what is selected) * On the graph's settings data tab, what is selected for the stream's cycle and rollup statistic? The graph might be trying to calculate the 15 second cycle based on the stream's base cycle which is probably a lot higher than 15 seconds - just a guess. You could try changing the stream's base cycle to 15 seconds and give it a default rollup method of "Last". See if that helps. |
||
| Post 37 • IP flag post | ||
|
|
xcguy private msg quote post Address this user | |
| That seems to have solved the problem - I changed the component stream cycle to 15 seconds, and then had to go back and set the rollup to 'Last' to get all the points to finally graph. Thanks! | ||
| Post 38 • IP flag post | ||
|
|
AEX private msg quote post Address this user | |
| Where do I select the cycle/rollup on the graph? I'm a fairly new customer to Grovestreams so I'm not sure if things have changed/moved or if I'm just not seeing it. Thanks |
||
| Post 39 • IP flag post | ||

|
MikeMills private msg quote post Address this user | |
There are two places to select the rollup cycle for a graph.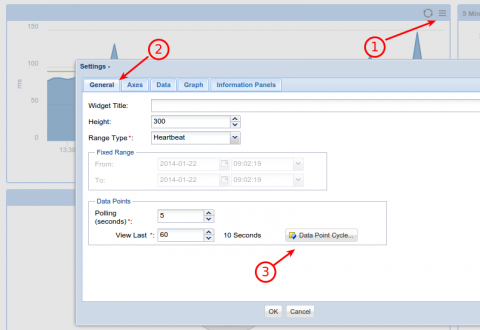 1. On the Graph Settings General tab. A selection made here will force the time series axis (bottom) tics to match the cycle and force all stream data points to convert to this cycle. 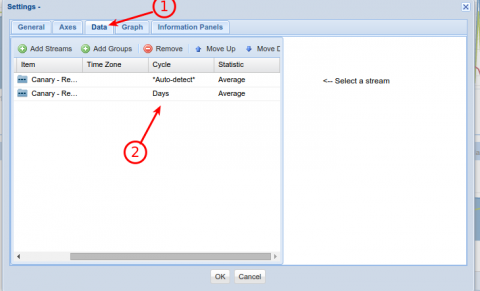 2. On the settings Data tab. This will be the rollup cycle/statistic that gets graphed. If a cycle is selected on the General tab, then this cycle will auto convert to the cycle selected. Play with both to understand what they do. |
||
| Post 40 • IP flag post | ||
|
|
AEX private msg quote post Address this user | |
| Ah.. I am blind. Thanks for clarifying! That helped square up the graph some but I'm still getting sloped transitions from 0->1 and to a lesser extent 1->0.  Any ideas? |
||
| Post 41 • IP flag post | ||

|
MikeMills private msg quote post Address this user | |
Did you set Step to true for each stream on the data tab?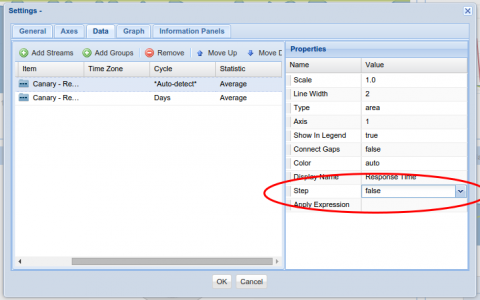 |
||
| Post 42 • IP flag post | ||
|
|
AEX private msg quote post Address this user | |
| That did it. Thanks! |
||
| Post 43 • IP flag post | ||