Latest Changes35

|
MikeMills private msg quote post Address this user | |
| 1) Added an Energy Cost Tutorial. 2) Fixed Embedded widgets not appearing in IE11 bug: See https://forum.grovestreams.com/topic/120/embed-widget-in-code-html/ 3) Fixed selecting event_instance within the API key Editor resource type menu not working bug. See towards the bottom of this thread for details: https://forum.grovestreams.com/topic/101/html-widget-and-new-share-dashboard-link/ |
||
| Post 26 • IP flag post | ||
|
|
MikeMills private msg quote post Address this user | |
| 1) Added the ability to auto-detect if stream text values are URLs, and if so, allow the user to click on them. See https://forum.grovestreams.com/topic/119/ftp-feeds/ | ||
| Post 27 • IP flag post | ||
|
|
MikeMills private msg quote post Address this user | |
| 1) GS now sends a System Notification when new streams are created dynamically during a feed PUT. 2) Added the capability to copy an Action Package within the same organization. 3) Fixed graph tick interval setting not saving bug. |
||
| Post 28 • IP flag post | ||
|
|
MikeMills private msg quote post Address this user | |
| 1) Added the ability to only show markers instead of lines within chart widgets. See https://forum.grovestreams.com/topic/130/line-chart-without-lines/ 2) Fixed a bug within widget charts that caused lines to not appear if one of the streams had not uploaded data within the time span being viewed when X number of Cycles were chosen. 3) Added the ability to set a margin to the chart time axes so that columns and lines will not cover the vertical axes labels. See https://forum.grovestreams.com/topic/132/vertical-bar-chart-covering-left-hand-axis/ 4) SMS support for Mexico. |
||
| Post 29 • IP flag post | ||
|
|
MikeMills private msg quote post Address this user | |
| 1) Applied patch for Random Stream Viewer. See https://forum.grovestreams.com/topic/135/unable-to-view-stream-data--12-hours/ | ||
| Post 30 • IP flag post | ||
|
|
MikeMills private msg quote post Address this user | |
| 1) In an effort to provide additional functionality and simplify the use of GroveStreams, we have added the capabilities of the Interval stream into the Random stream to form a new stream. The new stream is referred to as just “Stream” or regular stream. There is no such thing as a “Random” stream anymore. For more details, see https://forum.grovestreams.com/topic/141/one-stream-fits-all/ 2) The ability to assign some stream defaults within an organization. See https://forum.grovestreams.com/topic/142/organization-stream-defaults/ 3) Fixed Random stream event dwell bug. Dwell was being ignored under some conditions for regular streams (formally Random streams). 4) Added the ability to copy component events. 5) Increased the maximum amount of component events from 25 to 100. 6) Improved Table View performance to allow 10s of thousands of rows to be viewed or exported. |
||
| Post 31 • IP flag post | ||
|
|
MikeMills private msg quote post Address this user | |
| 1) Updated the Arduino tutorial sketch and the Arduino system blueprint - Removed Interval streams from the tutorial and added organization system defaults. 2) Updated system Standard Blueprint - Added organization system defaults. |
||
| Post 32 • IP flag post | ||
|
|
MikeMills private msg quote post Address this user | |
| 1) Tutorials: - Created an Electric Imp Quick Start Tutorial - Created a Java Quick Start Tutorial - Renamed other tutorials to indicate their complexity 2) Fixed Stream Quick View for regular streams. It was defaulting the graph to its base cycle intervals instead of its samples. |
||
| Post 33 • IP flag post | ||
|
|
MikeMills private msg quote post Address this user | |
| 1) Fixed usage stream count bug which caused an under count of streams for customer monthly bills. Since stream counts are calculated as the daily average for the month, the counts will be low for this month too. Think of this bug as a gift from us to you! | ||
| Post 34 • IP flag post | ||
|
|
MikeMills private msg quote post Address this user | |
| 1) Added two new settings to Interval Stream Derivation: * Perform derivation when any variable is NULL * Perform derivation when Any dependent values have arrived. See this thread for an example of their usage. These two settings are new and should not be used in production until they leave beta.  2) Changed Raspberry Pi blueprint to use regular streams instead of interval streams. 3) Fixed multiple issues around selecting cycles for random streams within expression derivation panels. 4) Servers were moved into a new state-of-the art data center. We are now located in SingleHop Chicago-3. |
||
| Post 35 • IP flag post | ||
|
|
MikeMills private msg quote post Address this user | |
1) Added "Step" option to line graphs. See this thread for more details: https://forum.grovestreams.com/topic/152/is-there-a-way-to-create-a-binary-graph/: 2) Added tab popup menu for observation studio:  3) Refactored underlying stream/component locking strategy in preparation for 10 second limit algorithm change. 4) Fixed derivation cycle and statistic selection bugs in web UI. 5) Exposed these two new settings for Regular and Point Stream Derivation (these are in Beta mode): * Advanced - Perform derivation when any variable is NULL * Advanced - Perform derivation when Any dependent values have arrived. 6) Added a System variable called LAST_VALUE which is the derived stream's last value prior to the current calculation. The Allow Nulls option must be enabled since this variable will be null for the first calculation. This variable is useful for things like counter or running totals streams. We'll provide an example of counter streams within the forum soon. This enhancement is in beta mode. You will need to use the isNull function like this if(isNull(var1), 0, var1) within your expression when the Allow Nulls option is enabled. |
||
| Post 36 • IP flag post | ||
|
|
MikeMills private msg quote post Address this user | |
| 1) Fixed Action Package copy bug that prevented Action Packages from copying at all. 2) Improved the ten second feed PUT limit algorithm. See: https://forum.grovestreams.com/topic/155/10-second-feed-put-limit-algorithm-change/ |
||
| Post 37 • IP flag post | ||
|
|
MikeMills private msg quote post Address this user | |
| 1) New home page and marketing pages 2) Fixed Table View Widget refresh issues 3) Fixed regular stream viewer time range selection refresh bug 4) Increased the number of rows view-able within stream viewer |
||
| Post 38 • IP flag post | ||
|
|
MikeMills private msg quote post Address this user | |
| 1) Made the user's start page and studios more phone friendly. 2) Fixed stream view cycle selector time ranger to calculate a range less than or equal to the maximum number of intervals so that the "Too Many Intvls" dialog is not displayed. |
||
| Post 39 • IP flag post | ||
|
|
MikeMills private msg quote post Address this user | |
| 1) Added a GroveStreams and SmartThings tutorial. Special thanks to Jason Steele, SmartThings community member, who is responsible for most of the tutorial! 2) Added an Arduino Yún Tutorial. 3) Added the ability for OEM'rs to change the home page graphic:  To change the graphic, click on your name and select Account:  1. Choose Branding Groups tab 2. Select a branding group 3. Click Change Home Page Graphic 4. Upload your graphic |
||
| Post 40 • IP flag post | ||
|
|
MikeMills private msg quote post Address this user | |
| 1) Fixed Account and Profile links from many marketing pages 2) Added the ability to change a graph widget title and label colors:  1. Edit your graph widget 2. The title can contain a couple of html elements: <b>, <br/>, <i> 3. Title and axes label colors 4. The background color of the widget 3) Added the ability to change a Dashboard background color:  4) Added the ability to change Steel Series Widget background colors Sample Dashboard with widget titles and borders hidden:  (Yeah, it's cold in my garage today!) |
||
| Post 41 • IP flag post | ||
|
|
MikeMills private msg quote post Address this user | |
| 1) Fixed shared dashboard background color bug. BG color was not being applied to shared dashboards. 2) New Shared Dashboard Options:  1. Open your dashboard and select Share Dashboard 2. Set the title of the shared dashboard or leave it blank to not display a title at all. 3. Set the title color of the shared dashboard. |
||
| Post 42 • IP flag post | ||
|
|
MikeMills private msg quote post Address this user | |
| 1) Dashboard graph widget navigator fix. The graph navigator was not being refreshed with new data when the dashboard or widget refresh button was clicked. 2) Added widget height shortcut buttons to widget toolbars. 3) Fixed stream export bug around special characters such as the degree symbol. 4) Added Apple meta tags to shared dashboard html pages. This will make the GS Dashboard look more like an app, and not a browser page, on Apple Products by choosing "Add to Home Screen" in your iPhone or iPad and opening the link from the home screen. 5) Dashboard graph widgets now label the last (top most) y-axis tic line. 6) Fixed a bug in the stream picker window that prevented multiple selections. |
||
| Post 43 • IP flag post | ||
|
|
MikeMills private msg quote post Address this user | |
| 1) Fixed a bug that prevented maps inside shared dashboards from displaying info windows when component or event markers were clicked. 2) Fixed a Regular stream Value Event bug that could occur when delay and dwell are used. It could display the wrong date in the notification and also could cause an error to occur each time a feed was uploaded triggering a system notification to arrive describing the error. 3) Changing an Org Logo from within an organization menu option was not working. We have removed this menu option. Org logos must now be managed through Branding Groups (Account - Branding Groups). |
||
| Post 44 • IP flag post | ||
|
|
MikeMills private msg quote post Address this user | |
| 1) Fixed Stream Picker multi-select bug 2) Fixed "missing stream" error message after creating a component from a component template that had derived streams. 3) Fixed a bug that sometimes prevented dashboard charts from auto-refreshing if the client's computer clock was slow and polling was set to a fast setting. 4) We now allow the name of component template to be entered when it is created from a component. |
||
| Post 45 • IP flag post | ||
|
|
MikeMills private msg quote post Address this user | |
| * Added a command and settings framework. Send commands and device settings to your devices, through your firewall, from GroveStreams! - Added a Yun Command Feeder Example . This example is a good way to become familiar with the GroveStreams command framework. - Added Request Stream parameters (rsid) to the PUT Feed (No JSON Body) API. The inclusion of rsid URL parameters will cause the Feed PUT call to return stream last_values. This is used as part of the command framework. - Added a new Stream Feed Form dashboard widget. This widget allows stream values to be set from a dashboard widget. It is used optionally as part of the new command framework. It also allows users to enter new stream values manually.  - See this forum thread for more details - A Dashboard with new Stream Feed Form widget that updates Power and Sample Rates on a smart plug which flow back to the device: 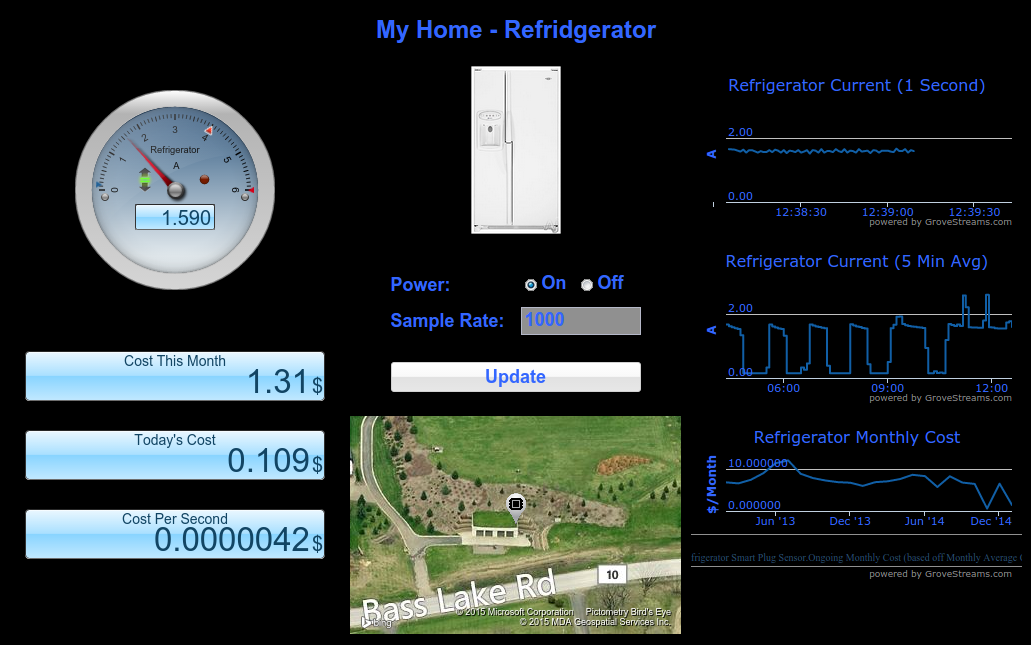 * Upgraded our charting package to a newer version. Some users were seeing browser lockup issues. We tracked it to our charting package graphics engine. We're hoping this resolves the issue. See this thread for more details. * Added a new stream value type Direction360. It is used for streams that measure direction in degrees 0-360 (360 exclusive). Use this stream with the Steel Series Wind Direction Gauge to ensure the Average direction reported is calculated correctly. See this thread for more details. * Added the ability to export line and bar graphs as png, jpec, svg vector, and pdf documents:  * Added the ability to monitor events based on seasons, days of the week, and time of day. This is performed by associating a time filter with a Value Arrival or Value Condition event. This could be done before by creating a derived stream from the original stream and associating the time filter with it, but adding this new feature is much more intuitive and keeps stream counts lower.  * Fixed an issue where Latency Events were ignored for streams after a user chose to "Delete All Time Series" data for that stream or its component. * Added a GroveStreams admin switch that will allow maps to be navigated (pan, zoom) on shared dashboards or widgets. You must contact us when you require this feature so that we can enable it for your organization. * Fixed an issue that prevented Point stream default values from being transferred to new components created from the template. |
||
| Post 46 • IP flag post | ||
|
|
MikeMills private msg quote post Address this user | |
| * Fixed line and bar chart widget graphing issue. The charting package we upgraded to yesterday had issues determining the series clipping boundaries when animation was turned off. We had animation off for performance reasons. * Enabled animation for line and bar chart widget graphing! This solves the problem above until a patch for our chart library is available. We may just leave animation enabled as long as no one is experiencing performance issues when their charts first appear and the series animate across the graph. |
||
| Post 47 • IP flag post | ||
|
|
MikeMills private msg quote post Address this user | |
| * Improved dashboard chart performance when there are many widgets, streams, and data points. See this thread for more information. * Added Line Chart Smoothing Capability - Edit your widget, Select the data tab, choose type spline or areaspline  * Fixed RSS Feed issue which prevented certain RSS Feed URLs from populating RSS derived stream feeds. |
||
| Post 48 • IP flag post | ||
|
|
MikeMills private msg quote post Address this user | |
| * Applied Derived RSS Stream patch. An RSS Feed URL that required a password was causing our RSS feed engine to throw an exception which prevented some other feeds from running. We improved exception handling so that the bad URL error message gets reported as an organization system notification and does not interfere with other feeds. | ||
| Post 49 • IP flag post | ||
|
|
MikeMills private msg quote post Address this user | |
| * New Dashboard Design Toolset * New Dashboard View in New Browser Tab feature. Ideal for testing your dashboard design * Fixed an issue with sharing an organization as Public. An error could occur when a guest tried to enter. |
||
| Post 50 • IP flag post | ||
|
|
MikeMills private msg quote post Address this user | |
| * Added Zooming setting to line/column chart. Options are No Zooming, Y only, X only, and X & Y Zooming. This option is needed for phones and tablets as it's hard to scroll graph widgets on a phone or tablet when Y zooming is enabled. * Fixed issue where a shared dashboard would display the dashboard name as its title even if there were no title configured. *Fixed missing widget toolbar buttons for some browsers. |
||
| Post 51 • IP flag post | ||
|
|
MikeMills private msg quote post Address this user | |
| * Fixed issue that prevented legacy dashboards (dashboards created before March 2, 2015) from rendering with their widgets in the correct spaces. | ||
| Post 52 • IP flag post | ||
|
|
MikeMills private msg quote post Address this user | |
| * Fixed intermittent missing graphs and headers issue when switching between dashboard tabs in Observation Studio. | ||
| Post 53 • IP flag post | ||
|
|
MikeMills private msg quote post Address this user | |
* Added dashboard widget header CSS Style setting: * Added Align Multi-Axes Tics setting to the chart widget. Aligning tic lines for multi-axes graphs was enabled by default in the past. The underlying algorithm would sometimes change axis minimum and maximum settings to accomplish the alignment. Disable alignment to prevent min/max values from changing.  * Added fromBase(string, base) method to the derivation expression engine. fromBase converts strings to numbers. fromBase("0400.2", 10) will return 400.2 (or 400 if your stream has a value type of short, int, or long). The 10 parameter indicates the conversion is decimal. "0x" in place of 10 would indicate from hex. * Upgraded charting package to the latest version and turned off animation. * Improved shared dashboard layout within phones and tablets. We added the following meta tag to the shared dashboard html page: <meta name="viewport" content="width=device-width, initial-scale=1"/> Shared dashboards will render to the size of the device's view-able area. A good dashboard design will be responsive so that it adjusts itself to the device being used. Play with the column layout settings in combination with number of columns and minimum columns while viewing your dashboard in a browser and within a device to ensure your dashboard displays correctly in both. See this thread for mobile testing your dashboard. * The previous stream's widget settings are now automatically copied to new streams when they are added to widgets. This speeds up the design of large dashboards when data series have many of the same settings. Some settings don't get copied over such as the display name, line color, and some units (Steel Series series). |
||
| Post 54 • IP flag post | ||
|
|
MikeMills private msg quote post Address this user | |
* The ability to modify values within a dashboard widget using a formula expression. See this thread for more details. * Added Stream Group Display Name to stream visuals definition. Enter a name here to have that name appear in dashboard widgets when the stream is part of a Stream Group.  * Added the ability to change settings for multiple streams within all Steel Series widgets. This simplifies the editing of large dashboards. Changing a setting on the right will apply to all rows that are currently selected. This enhancement only applies to Steel Series widgets. We'll eventually do the same for most of our widgets.  |
||
| Post 55 • IP flag post | ||