Latest Changes35

|
MikeMills private msg quote post Address this user | |
| * Added Zooming setting to line/column chart. Options are No Zooming, Y only, X only, and X & Y Zooming. This option is needed for phones and tablets as it's hard to scroll graph widgets on a phone or tablet when Y zooming is enabled. * Fixed issue where a shared dashboard would display the dashboard name as its title even if there were no title configured. *Fixed missing widget toolbar buttons for some browsers. |
||
| Post 51 • IP flag post | ||

|
MikeMills private msg quote post Address this user | |
| * Fixed issue that prevented legacy dashboards (dashboards created before March 2, 2015) from rendering with their widgets in the correct spaces. | ||
| Post 52 • IP flag post | ||

|
MikeMills private msg quote post Address this user | |
| * Fixed intermittent missing graphs and headers issue when switching between dashboard tabs in Observation Studio. | ||
| Post 53 • IP flag post | ||

|
MikeMills private msg quote post Address this user | |
* Added dashboard widget header CSS Style setting: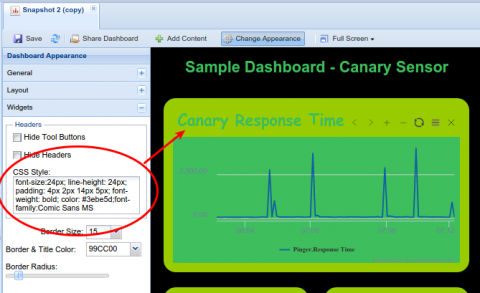 * Added Align Multi-Axes Tics setting to the chart widget. Aligning tic lines for multi-axes graphs was enabled by default in the past. The underlying algorithm would sometimes change axis minimum and maximum settings to accomplish the alignment. Disable alignment to prevent min/max values from changing. 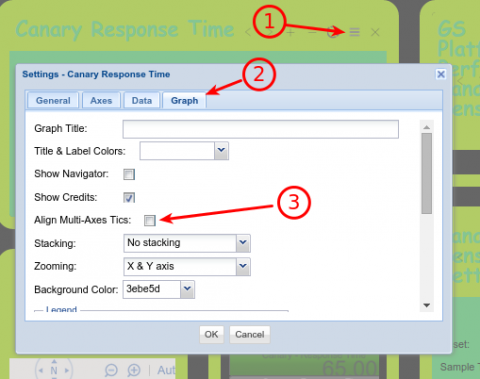 * Added fromBase(string, base) method to the derivation expression engine. fromBase converts strings to numbers. fromBase("0400.2", 10) will return 400.2 (or 400 if your stream has a value type of short, int, or long). The 10 parameter indicates the conversion is decimal. "0x" in place of 10 would indicate from hex. * Upgraded charting package to the latest version and turned off animation. * Improved shared dashboard layout within phones and tablets. We added the following meta tag to the shared dashboard html page: <meta name="viewport" content="width=device-width, initial-scale=1"/> Shared dashboards will render to the size of the device's view-able area. A good dashboard design will be responsive so that it adjusts itself to the device being used. Play with the column layout settings in combination with number of columns and minimum columns while viewing your dashboard in a browser and within a device to ensure your dashboard displays correctly in both. See this thread for mobile testing your dashboard. * The previous stream's widget settings are now automatically copied to new streams when they are added to widgets. This speeds up the design of large dashboards when data series have many of the same settings. Some settings don't get copied over such as the display name, line color, and some units (Steel Series series). |
||
| Post 54 • IP flag post | ||

|
MikeMills private msg quote post Address this user | |
* The ability to modify values within a dashboard widget using a formula expression. See this thread for more details. * Added Stream Group Display Name to stream visuals definition. Enter a name here to have that name appear in dashboard widgets when the stream is part of a Stream Group. 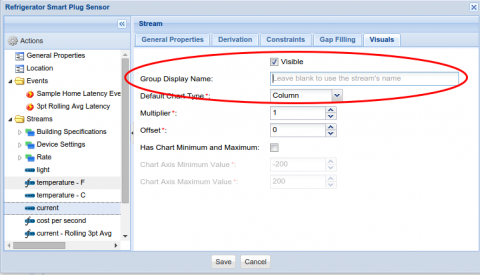 * Added the ability to change settings for multiple streams within all Steel Series widgets. This simplifies the editing of large dashboards. Changing a setting on the right will apply to all rows that are currently selected. This enhancement only applies to Steel Series widgets. We'll eventually do the same for most of our widgets. 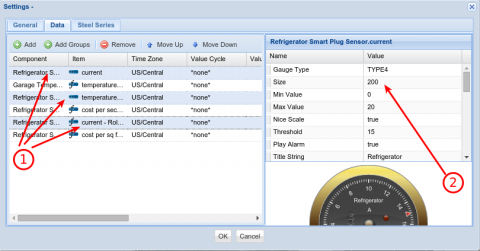 |
||
| Post 55 • IP flag post | ||

|
MikeMills private msg quote post Address this user | |
* Added Color Thresholds to Steel Series Widgets. More information can be found in this thread.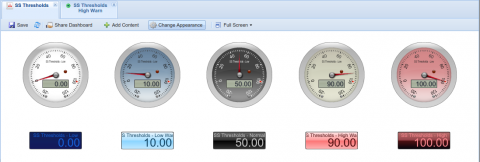 * Multiple selected stream setting changes apply to most widget settings windows now. This will make editing visual settings for widgets with a lot of streams easier. * Fixed dashboard widget crashes when opening and closing widget settings windows with combo box settings in the property grid. * Fixed share map bug * Fixed missing Threshold Max setting from Steel Series Single widget |
||
| Post 56 • IP flag post | ||

|
MikeMills private msg quote post Address this user | |
| * New start page beta. Find out more here. Example: 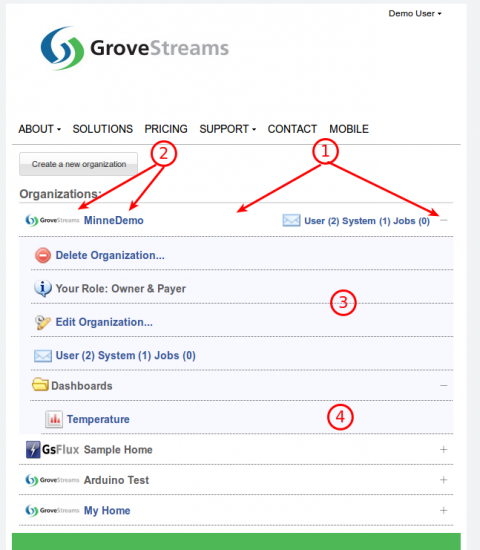 * Fix issues with opening and closing widget setting windows on Firefox. More information here. |
||
| Post 57 • IP flag post | ||

|
MikeMills private msg quote post Address this user | |
* New Stream Swapper. See this thread for more details.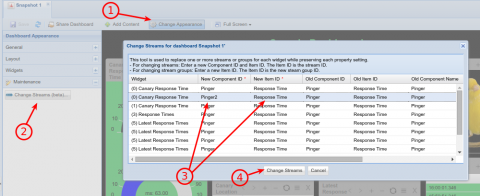 * Fixed an issue that prevented the viewing of Account billing metrics |
||
| Post 58 • IP flag post | ||

|
MikeMills private msg quote post Address this user | |
| * Fixed an issue that prevented "step" and "connect gaps" chart widget settings from appearing in the properties list. | ||
| Post 60 • IP flag post | ||

|
MikeMills private msg quote post Address this user | |
* Added Steel Series latency visual indicators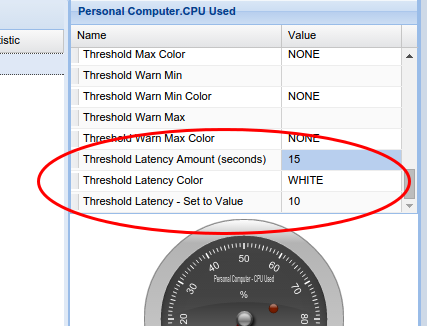 * Created asPut feed API parameter which allows feeds to be uploaded with a GET HTTP method instead of a PUT method. This is for gateways that only support GET methods. See this thread. |
||
| Post 61 • IP flag post | ||

|
MikeMills private msg quote post Address this user | |
* We've added the ability to display each axes within its own pane on the same graph while using the same navigator bar for all panes. See this thread for more details.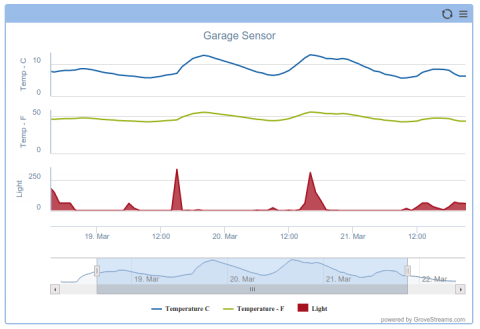 * SMS messaging has been enabled for Romania. Just a reminder - please notify us if you are getting a system notification stating: Permission to send an SMS has not been enabled for the region indicated by the 'To' number: +xxxxxxxxxxx We enable SMS regions as you request them. Why do we do this? Because our SMS provider highly recommends not enabling the entire world at one time to lessen the odds of malicious use of the service. |
||
| Post 62 • IP flag post | ||

|
MikeMills private msg quote post Address this user | |
| * Information Panels have been added to most widgets. This allows for "extra" information to be displayed with widgets such as: - Graphics - Text including instructions - URL links to other pages or other GS dashboards See this thread for more information. 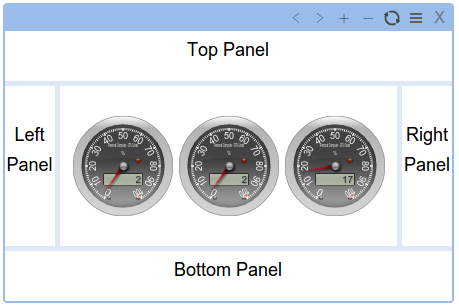 |
||
| Post 63 • IP flag post | ||

|
ctmorrison private msg quote post Address this user | |
| New features are always appreciated! However, if existing sites will be impacted, even visually, it would be helpful to have a "heads up!". I just went through all of our dashboards to correct issues that required widgets to be enlarged vertically due to some real estate changes. Again, the continuous improvements are greatly appreciated. |
||
| Post 64 • IP flag post | ||

|
MikeMills private msg quote post Address this user | |
| Changes, including this one, should not impact existing dashboards. Please notify us when you encounter a change impacting your existing views and we'll investigate it right away. Sorry about the impact! | ||
| Post 65 • IP flag post | ||

|
MikeMills private msg quote post Address this user | |
| * Fixed an issue that was causing "powered by GroveStreams.com" from appearing under every existing widget. It should only appear under new widgets. | ||
| Post 66 • IP flag post | ||

|
ctmorrison private msg quote post Address this user | |
| I believe this is what caused all my Dashboards to need resizing of widgets. This is still showing up on most of the widgets on all Dashboards--even ones that were defined months ago. I've also lost the means to make the former tag line not show up from the graph widgets. BTW, this shows up apparently 'cause it's been pushed to all Information Panels -- bottom. |
||
| Post 67 • IP flag post | ||

|
MikeMills private msg quote post Address this user | |
| * Fixed an issue that caused an error message to temporarily appear when clicking on an organization name from the start page. Seemed to be an issue only with FireFox. * Removed the "powered by GroveStreams.com" from all existing graph widgets. This line was part of the graph itself. We have now moved the line out of the graph control and into the bottom Information Panel for all new widgets. |
||
| Post 68 • IP flag post | ||

|
MikeMills private msg quote post Address this user | |
| * Fixed an issue preventing the navigation to Observation Studio from the user's start page when the logo was clicked. * Fixed an issue that could prevent graphs in the mobile site from appearing if the last sample received was over a day ago. |
||
| Post 69 • IP flag post | ||

|
MikeMills private msg quote post Address this user | |
| * Fixed issues that arise when deleting a small series of samples from a regular stream that are not towards the tail of the stream and over a day old. See this thread. * Fixed an issue that prevented a user from signing-in when a guest session has started in the same browser session. * Organization list is now sorted by name on the start page. * Browser page navigation prompt is now shown when leaving a page that has an unsaved dashboard or map to give users the chance to cancel the navigation and save their changes. * Added Tick Interval to graph widgets. The Tick Interval setting allows you to specify the time interval of the ticks on the X-axis (the time series axis). If the interval is too small or too large, the graph will override the amount entered. A blank value indicates to auto calculate the tick interval (default). 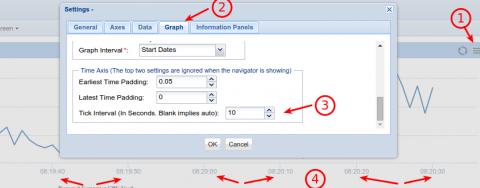 |
||
| Post 70 • IP flag post | ||

|
MikeMills private msg quote post Address this user | |
| * Fixed an issue within the start page that caused two dashboard browser tabs to open for FireFox browsers. | ||
| Post 71 • IP flag post | ||

|
MikeMills private msg quote post Address this user | |
| * Fixed an issue with GS toolbar sub-menus sometimes disappearing when using Google Chrome version 43. | ||
| Post 72 • IP flag post | ||

|
MikeMills private msg quote post Address this user | |
| * Fixed an issue that caused charts to resize improperly. See this thread for more information. | ||
| Post 73 • IP flag post | ||

|
MikeMills private msg quote post Address this user | |
| * You're probably thinking we're sitting on a beach drinking piña coladas since this thread has been quite lately. No, we've actually been busy improving Access Security throughout GroveStreams. | ||
| Post 74 • IP flag post | ||

|
MikeMills private msg quote post Address this user | |
| * Applied a patch to fix an issue with regular stream events with time filters associated with the event (advanced options). More information here. | ||
| Post 75 • IP flag post | ||

|
MikeMills private msg quote post Address this user | |
| * Increased cluster storage capacity by 60%. This allows for more than one half of the cluster to go down and still be operational. * Increased cluster job processing capacity by 60%. This allows all jobs to finish faster. |
||
| Post 76 • IP flag post | ||

|
MikeMills private msg quote post Address this user | |
| * New Billing Plans - New Free plans will block feed calls when free limits are hit until the next billing cycle. Free accounts will not be forced to register a credit card since limits are now strictly enforced. * Added user groups. Introduced secured content stores for components and maps/dashboards. * Fixed an issue that triggered multiple action packages for "Value Arrive" events on regular streams. * Added a "Purge" button to notification windows. Allows for all notifications to be purged at one time. * Upgraded charting toolkit. Should help with the blue squares issue in Chrome. * Fixed an issue that prevented Feed upload rate limit checks when POST was called instead of PUT. * Added larger expand icons to organizations within start page * Organizations are now auto-expanded on the start page for users with one organization. |
||
| Post 77 • IP flag post | ||
|
|
jonrichings private msg quote post Address this user | |
| Mike, I can't load component data for any component. The stream list populates as does the quick view (a bit slower than before) but the main (tabbed) view never loads, the "Displaying Component" loading popup just hangs around and the window stays gray. Dashboard tabs work fine. I've refreshed the page, logged out and logged in again with the same result. |
||
| Post 78 • IP flag post | ||
|
|
jonrichings private msg quote post Address this user | |
| Oh, and sorry to say this, but the blue box issue is still there. Haven't tired clearing the cache though. If you can tell me the name of the lib I'll hunt that down and delete it. Don't really want to lose the rest of the good stuff in my cache. | ||
| Post 79 • IP flag post | ||

|
MikeMills private msg quote post Address this user | |
| * CompView not appearing. We're creating a patch for that * Blue box issue. We'll investigate more after we patch the serious issues that are appearing * Latency Event notifications are repeating - This one is currently under investigation. |
||
| Post 80 • IP flag post | ||